ARL Model Graphics
Air Resources Laboratory
Posted 4/2010 / Updated 12/2023
https://www.ready.noaa.gov/READYcmet.php
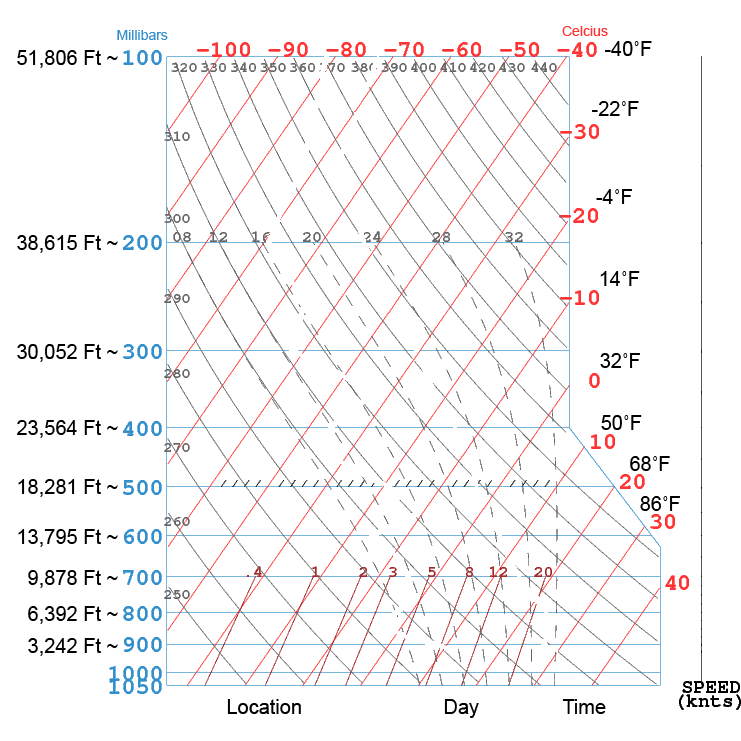
The see a Skew-T graph
Note: reviewing Skew-T sounding graphs for different locations can be cumbersome
and time consuming but they are often one of the best tools to visualize the
atmospheric profile.
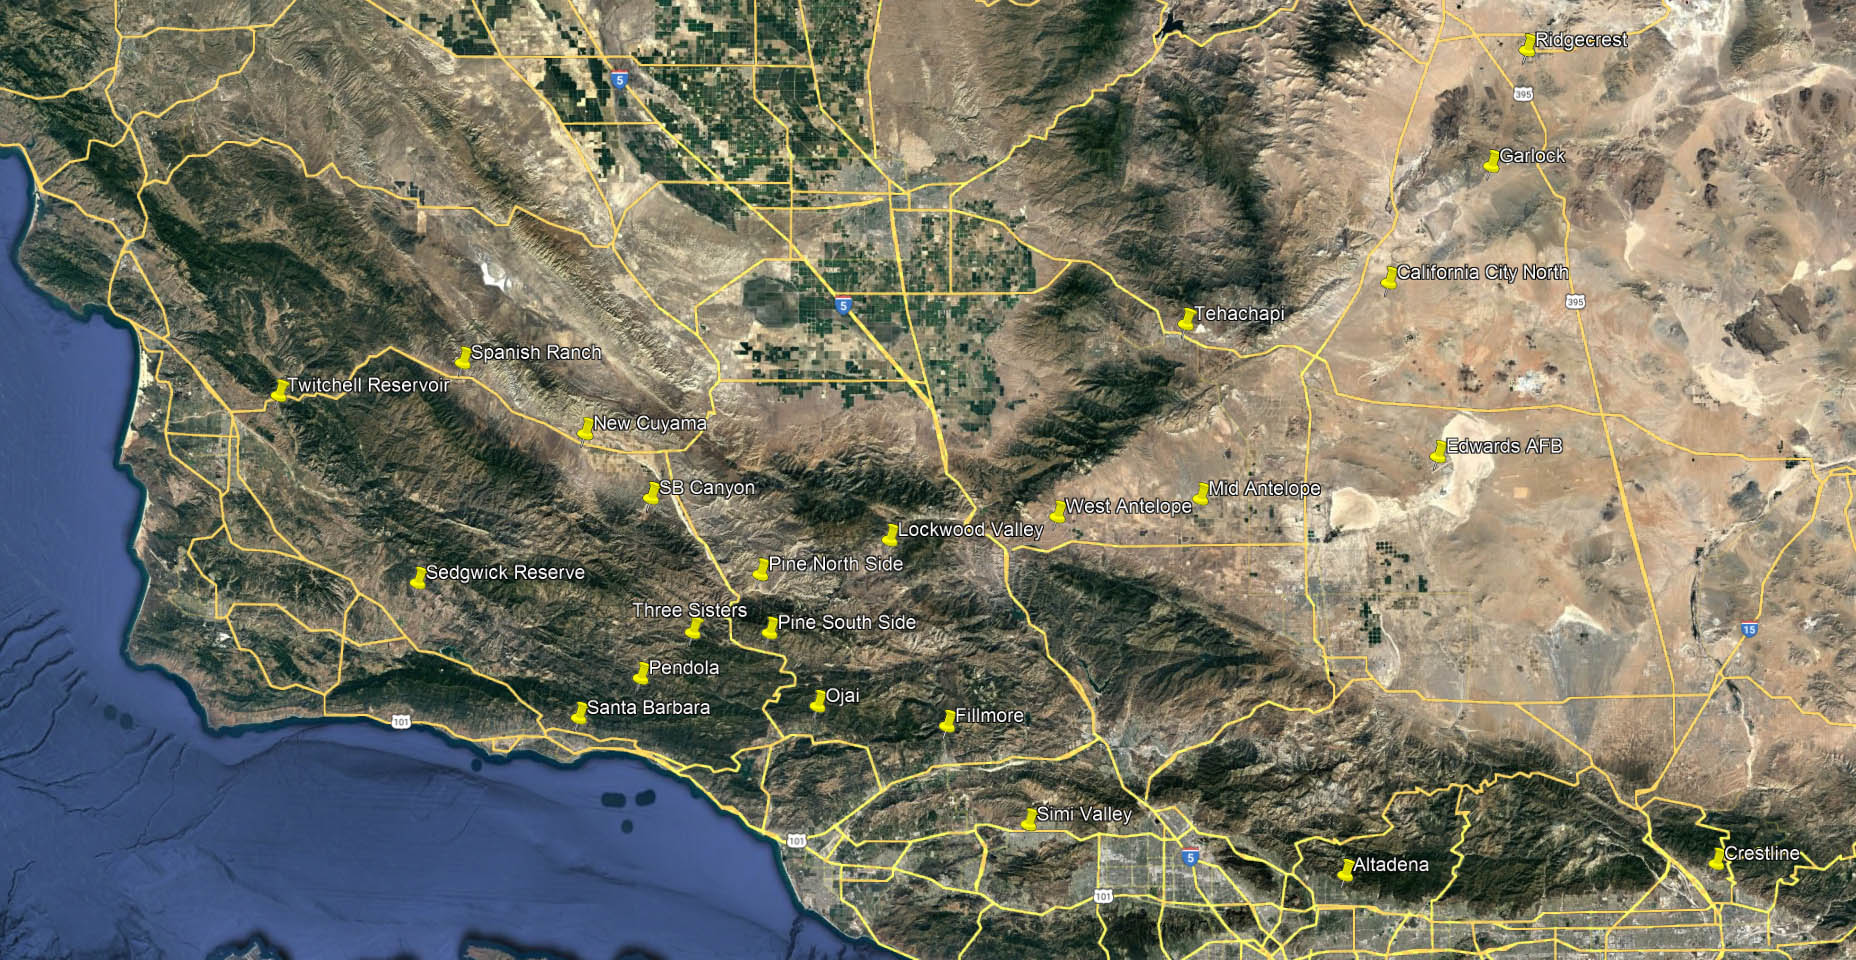
| Spanish Ranch | 35.06 | -119.95 | Plowshare LZ below Takeoff by Hwy 166 |
| New Cuyama | 34.94 | -119.69 | Mid-Cuyama Valley near the airport |
| SB Canyon | 34.83 | -119.55 | Santa Barbara Canyon |
| Twitchell Reservoir | 35.00 | -120.34 | Just inland from Santa Maria |
| Sedgwick Reserve | 34.68 | -120.04 | Half way between Santa Ynez and Figueroa Mountain |
| Santa Barbara | 34.45 | -119.7 | Near the Botanic Garden in Mission Canyon or you can simply enter SBA for the Airport. The airport has different surface weather than the mountains, but the soundings look at weather above the surface. I don't think a few miles will make much difference, but I haven't studied the inner workings of the models. |
| Ojai | 34.47 | -119.2 | Near Senior Canyon (below Stooges and Twin Peaks) |
| Fillmore | 34.44 | -118.93 | Near the main LZs out in front of Oat Launch |
| Pendola | 34.52 | -119.57 | Up the Aqua Caliente Creek Canyon (Forest Rte 5N15) just north of the Pendola Ranger Station and Middle Santa Ynez Campground |
| Three Sisters | 34.6 | -119.46 | On the Divide Ridge north of Monte Arido |
| Pine South Side | 34.6 | -119.3 | The rocky ledges above Hwy 33 below the south launch |
| Pine North Side | 34.7 | -119.32 | The large ranch fields north of Pine Mountain and the Lockwood Vly Rd |
| Lockwood | 34.76 | -119.05 | Mid Valley Airport |
| West Antelope | 34.8 | -118.7 | center valley half way between Quail Lake and the first group of round fields |
| Mid Antelope | 34.83 | -118.4 | middle group of round fields north of the Fairmont Butte over the Skyotee Ranch Airport |
| Edwards AFB | 34.9 | -117.9 | SW end of the runway just west of the larger east lake |
| Tehachapi | 35.1 | -118.4 | fields 3 mi SE of the airport |
| California City N | 35.2 | -118.0 | North of California City / South of the Cantil (Honda) test track |
| Garlock | 35.4 | -117.78 | Just south of "town" on the flats |
| Ridgecrest | 35.6 | -117.7 | Just south of town |
| Simi Valley | 34.27 | -118.76 | Mid Town |
| Altadena | 34.18 | -118.1 | Base of Foothill Point NE of Pasadena |
| Crestline | 34.19 | -117.32 | CSS / Andy Jackson Airpark at the base of Marshall |
To read a Skew-T chart, there are tutorials available at:
Information on Blip Maps can be found at:
http://drjack.info
recommended reading by Don Taber